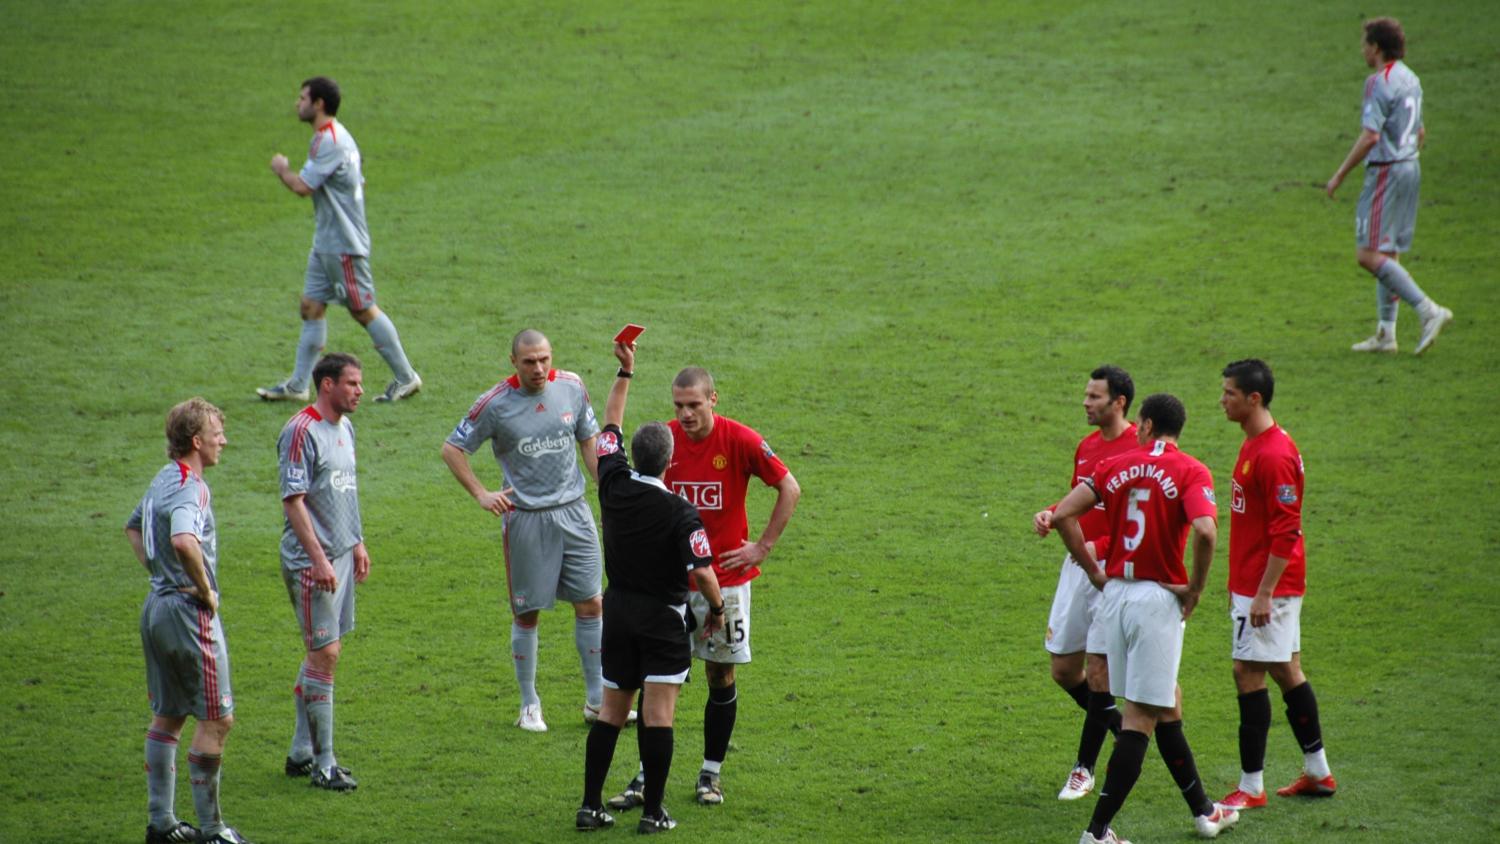
Red cards are absolute game-changers — punishments that are often too much for the offending team to overcome. But which club produces the most Premier League red cards? The second-ranked team will likely surprise you.
One would assume the club producing the most Premier League red cards to be one known for robust defenses or hotheaded players, but the truth does not match expectation. Everton in fact leads England with 89 red cards in Premier League history out of 49 clubs that have played in England’s top flight since the league debuted in 1992.
Below is a ranking of the most Premier League red cards and yellow cards by club. Some teams are lower on the list because they have spent fewer seasons in the Premier League. So clubs that have never been relegated are more likely to rank higher on the list than those who have spent time in the lower divisions. It’s the reason two current EPL clubs (Huddersfield and Brighton and Hove Albion) are ranked in the bottom six.
But this hasn’t stopped Newcastle from ranking in the top three despite spending two seasons in the Championship. Blackburn Rovers has spent seven seasons in the lower divisions but also ranks in the top five.
Perhaps the biggest surprise on this list is the team coming in at No. 2: Arsenal. The Gunners under Arsene Wenger are known for playing lovely football on offense but being a bit passive on defense, so their high ranking on this list is a bit unusual.
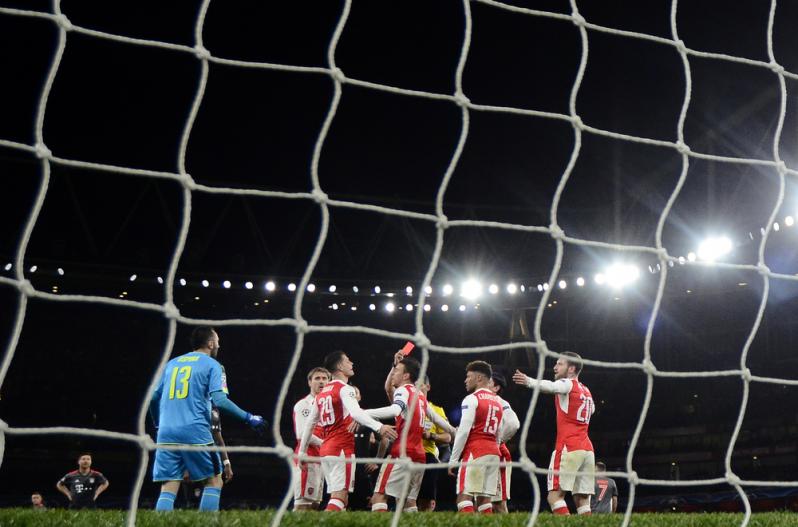 Arsenal ranks second in most Premier League red cards. Photo: @Cosminlftode | ShutterStock
The list for most yellow cards is a bit more diffuse, with Chelsea on top with 1,573. Everton is second and Arsenal is shifted down to third (still seems high). Interestingly, Tottenham ranks 10th in red cards but fourth in yellow cards. Newcastle went in the opposite direction, going from third in reds to eighth in yellows.
Regardless, without further ado, here is the ranking of the clubs with the most Premier League red cards, as of April 18, 2018. Below that is the ranking of the most Premier League yellow cards by club.
Clubs Producing The Most Premier League Red Cards
1. Everton — 89
2. Arsenal — 85
3. Newcastle — 80
4. Chelsea — 78
5. Blackburn Rovers — 77
6. West Ham United — 71
7. Manchester City — 65
8. Manchester United — 62
8. Sunderland — 62
10. Tottenham Hotspur — 61
11. Aston Villa — 56
11. Liverpool — 56
13. Southampton — 50
14. Middlesborough — 45
15. Bolton Wanderers — 44
16. Leicester City — 41
17. Fulham — 36
18. Stoke City — 31
18. West Bromwich Albion — 31
20. Leeds United — 28
21. Birmingham City — 27
21. Wigan Athletic — 27
23. Queens Park Rangers — 26
23. Wimbledon —26
25. Charlton Athletic — 24
25. Coventry City — 24
25. Hull City — 24
28. Portsmouth — 20
29. Sheffield Wednesday — 19
30. Crystal Palace — 18
30. Watford — 18
32. Derby County — 17
33. Norwich City — 15
34. Swansea City — 14
35. Wolverhampton Wanderers — 12
36. Nottingham Forest — 10
37. Reading — 9
37. Sheffield United — 9
39. Burnley — 6
39. Ipswich Town — 6
41. AFC Bournemouth — 5
42. Barnsley — 4
42. Oldham Athletic — 4
44. Huddersfield Town — 3
45. Blackpool — 2
45. Bradford City — 2
45. Brighton and Hove Albion — 2
48. Cardiff City — 1
48. Swindon Town — 1
Source: PremierLeague.com

Chelsea is first in the ranking of most Premier League yellow cards. Photo: @SROBET | Twitter
Clubs Producing The Most Premier League Yellow Cards
1. Chelsea — 1,573
2. Everton — 1,511
3. Arsenal — 1.468
4. Tottenham Hotspur — 1,442
5. Manchester United — 1,395
6. West Ham United — 1,389
7. Aston Villa — 1,362
8. Newcastle United — 1,265
9. Liverpool — 1,259
10. Manchester City — 1,214
11. Blackburn Rovers — 1,111
12. Sunderland — 1,095
13. Southampton — 1,046
14. Middlesborough — 973
15. Bolton Wanderers — 845
16. Leeds United — 790
17. Fulham — 708
17. West Bromwich Albion — 708
19. Stoke City — 668
20. Leicester City — 665
21. Crystal Palace — 539
22. Derby County — 538
23. Wigan Athletic — 512
24. Coventry City — 481
25. Birmingham City — 428
26. Charlton Athletic — 408
27. Wimbledon — 407
28. Portsmouth — 399
29. Norwich City — 394
30. Queens Park Rangers — 364
31. Swansea City — 359
32. Sheffield Wednesday — 341
33. Watford — 330
34. Hull City — 328
35. Nottingham Forest — 287
36. Wolverhampton Wanderers — 255
37. Burnley — 248
38. Ipswich Town — 183
39. Sheffield United — 170
40. AFC Bournemouth — 158
41. Reading — 142
42. Bradford City — 113
43. Oldham Athletic — 70
44. Barnsley — 66
45. Huddersfield Town — 56
46. Brighton and Hove Albion — 49
47. Cardiff City — 49
48. Blackpool — 47
49. Swindon Town — 39
Source: PremierLeague.comThe18 Recommends For You