The Australian A-League is in the midst of its 14th season, and although there are plans to expand the league by two teams by the start of the 2019-20 campaign (Macarthur South West United and Western United FC), attendance numbers remain a concern.
The league peaked with an average gate of 14,610 back in 2007-08, but that number has been steadily declining ever since. In fact, heading into this season, the A-League had experienced four straight years of dropping numbers. Last year, the average fell to 10,671 per game, and that number is only marginally better this season at 10,799.
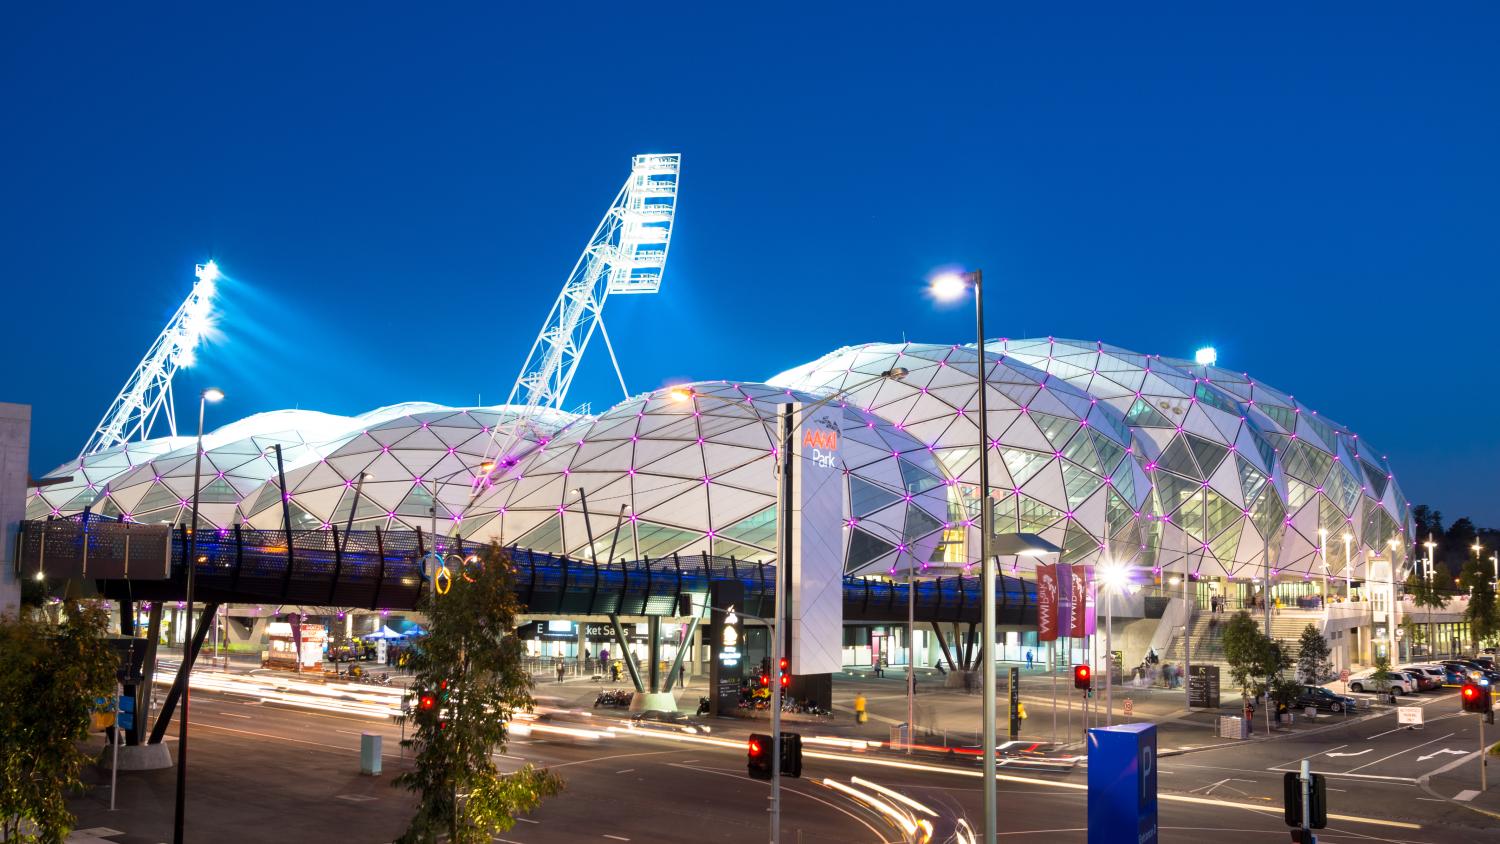
At the top of the charts is Melbourne Victory, who average 22,536 spectators at AAMI Park (capacity 30,050). At the bottom is the Central Coast Mariners (yes, the club that had Usain Bolt on trial), who average 6,102 fans at Central Coast Stadium (capacity 20,119).
A piece of good news for the league is that the Western Sydney Wanderers (second worst in the division with an average attendance of 8,335) will be moving from the oval-shaped Spotless Stadium to the brand-new Bankwest Stadium next season.
We could watch this for hours
Courtesy NSW Government #WSW pic.twitter.com/8UEciFW81o— WS Wanderers FC (@wswanderersfc) February 26, 2019
Also, Sydney FC is currently playing its home matches across three different grounds — Sydney Cricket Ground, Jubilee Oval and Leichhardt Oval — until the Sydney Football Stadium is rebuilt, which should be finished by 2022.

Concept image for Sydney Football Stadium. Photo: @stuartayresmp | Twitter
It’s interesting to note that while MLS is turning almost entirely to soccer-specific stadia, the A-League frequently shares grounds with teams from the National Rugby League, the Australian Football League and the Big Bash League. While the field dimensions between soccer and rugby make this venue-sharing somewhat negligible, it’s often disastrous for the pitch.
Also, a few teams (Sydney, Western Sydney and Wellington) currently play their matches in oval-shaped grounds, which offer terrible sight lines for many spectators.
The A-League is also unique in that the majority of the clubs either call Melbourne or Sydney home. These rivalries and local derbies often see matches moved into larger stadiums (like Marvel Stadium in Melbourne or ANZ Stadium in Sydney) for larger attendances.
Having said that, here's a look at the 2018-19 A-League stadiums. As you'll see, not all grounds are created equally when it comes to watching soccer.
A-League Stadium Guide and Average Attendances 2019
Adelaide United
Coopers Stadium
Capacity: 16,500
Opened in 1960, renovated in 2000.
2018-19 Average Attendance: 8,830
High: 12,115 | Low: 7,071
Brisbane Roar
Suncorp Stadium

Photo: @FootballStadia1 | Twitter
Capacity: 52,500
Opened in 1914, redeveloped between 2001 and 2003.
2018-19 Average Attendance: 10,396
High: 15,129 | Low: 7,131
Central Coast Mariners
Central Coast Stadium

Photo: @ALeague | Twitter
Capacity: 20,119
Opened in 2000.
2018-19 Average Attendance: 6,102
High: 8,923 | Low: 4,103
Melbourne City
AAMI Park

Photo: @aussiebeastmode | Twitter
Capacity: 30,050
Opened in 2010.
2018-19 Average Attendance: 8,925
High: 24,306 | Low: 5,149
Melbourne Victory
AAMI Park

Photo: @nova100 | Twitter
Capacity: 30,050
Opened in 2010.
Marvel Stadium*
*For matches against Melbourne City, Western Sydney Wanderers, Adelaide United and Brisbane Roar.

Photo: @marvelstadiumau | Twitter
Capacity: 56,347
Opened in 2000.
2018-19 Average Attendance: 22,536
High: 40,504 | Low: 16,508
Newcastle Jets
McDonald Jones Stadium

Photo: @LawrieMcKinna | Twitter
Capacity: 33,000
Opened in 1970, renovated between 2003-05 and 2008-11.
2018-19 Average Attendance: 9,084
High: 11,814 | Low: 6,701
Perth Glory
HBF Park

Photo: @TheGloryPost | Twitter
Capacity: 20,500
Opened in 1910, renovated in 2004 and 2012.
2018-19 Average Attendance: 9,633
High: 11,393 | Low: 7,213
Sydney FC*
*Sydney FC plays at the following three grounds until the Sydney Football Stadium is rebuilt.
Jubilee Oval

Photo: @joeBevacqua2 | Twitter
Capacity: 20,505
Opened in 1936, three-stage renovation between 2003-10.
Leichhardt Oval

Photo: @shannonbyrne23 | Twitter
Capacity: 20,000
Opened in 1934.
Sydney Cricket Ground*
*For matches against Western Sydney and Perth Glory

Photo: @PolskiWanderer | Twitter
Capacity: 45,500
Established in 1848.
2018-19 Average Attendance: 14,833
High: 30,588 | Low: 10,101
Wellington Phoenix
Westpac Stadium

Photo: @amirkhirudin | Twitter
Capacity: 34,500
Opened in 2000.
2018-19 Average Attendance: 8,586
High: 23,648 | Low: 4,829
Western Sydney Wanderers*
*Western Sydney will move into the Bankwest Stadium next year.
Spotless Stadium

Photo: @PolskiWanderer | Twitter
Capacity: 24,000
Opened in 1998, renovated in 2001.
ANZ Stadium*
*For matches against Sydney FC, Melbourne Victory and Perth Glory

Photo: @Marouche_Sam | Twitter
Capacity: 84,000
Opened in 1999.
2018-19 Average Attendance: 8,335
High: 18,043 | Low: 5,067
The18 Recommends For You